|
|
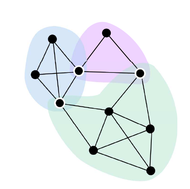
Many metrics exist to query local node-centric or global organization properties of networks. We compute four such statistics: average degree, clustering coefficient, global efficiency, and modularity (using BCT) at each step in the filtration. Then we can observe the evolution of these statistics as new edges/nodes are added to each graph.
Average Degree
The degree of any node n is the number of links emanating from it. We then take the average over nodes.
Clustering Coefficient
To asses the properties of each node's neighborhood, we compute the clustering coefficient of node n
Average Degree
The degree of any node n is the number of links emanating from it. We then take the average over nodes.
Clustering Coefficient
To asses the properties of each node's neighborhood, we compute the clustering coefficient of node n
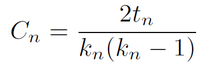
with t_n the number of triangles in which node n participates, and k the degree of node n. We report the average clustering coefficient over all nodes in the graph (Watts and Strogatz, 1998).
Global Efficiency
We query the global organization by first asking how rapidly information can be shared among nodes. The global efficiency of the network is defined
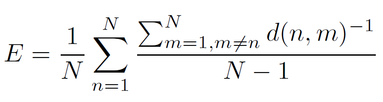
where d(n,m) is the topological distance between nodes n, m (Latora and Marchiori, 2001).
Modularity
Finally we query the presence of community structure by computing the modularity of the graph at each step in the filtration. From (Newman, 2006) we compute
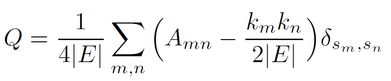
with A the binary adjacency matrix, and s_n the community of node n.